Bitcoin Death Cross Confirmed as Anthropic IPO Fails to Help
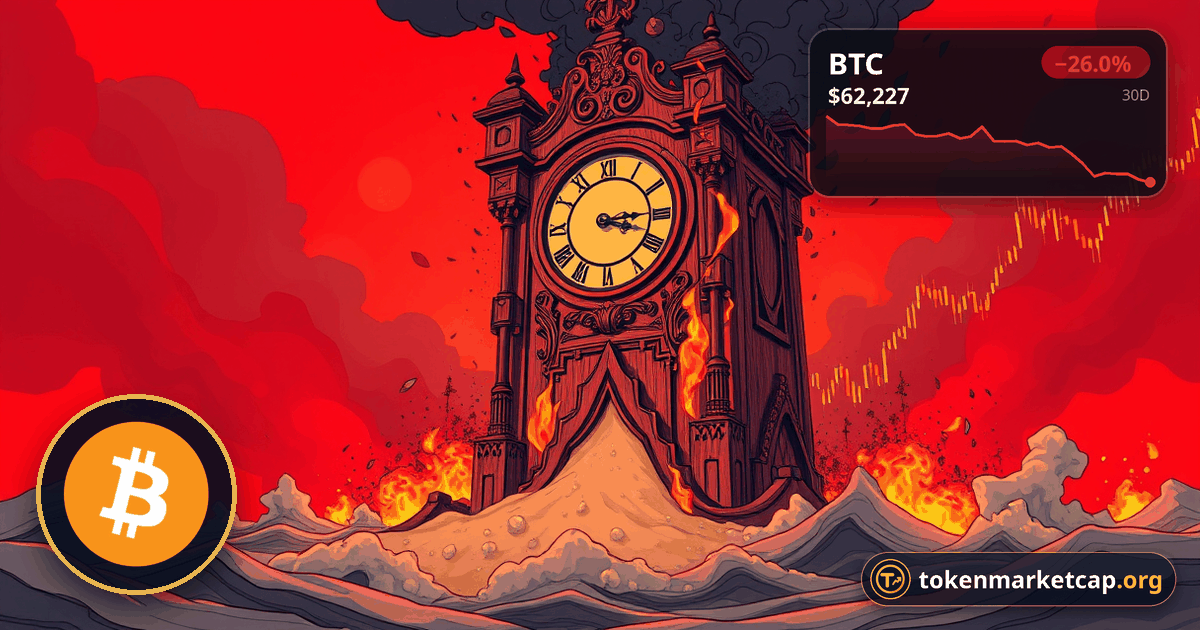
Bitcoin near $62,640 confirms an EMA death cross, 28% off its peak, as Anthropic's $81B Nasdaq debut fails to stop a broad risk-asset selloff.
Öne çıkanlar
- Bitcoin traded near $62,640 on Thursday, about 28% below its late-September peak close to $87,000.
- An EMA-based death cross was confirmed on BTC's daily chart, with RSI at 21.3 and ADX at 41.2.
- Anthropic raised $81.34 billion in its Nasdaq IPO, yet the Dow fell 2.03% and the Nasdaq Composite 1.55% by midday.
- U.S. spot Bitcoin ETFs have recorded about $2.9 billion in outflows this month, including $306.4 million on Wednesday.
Bitcoin BTC hovered near $62,640 on Thursday, 0.6% lower over 24 hours, after a moving-average crossover on its daily chart confirmed a bearish "death cross" signal. Anthropic's blockbuster Nasdaq listing did nothing to calm a wider retreat from risk. BTC now sits about 28% below its late-September high close to $87,000. Momentum readings show the market is deeply oversold, but sellers still control the trend.
A Record Listing That Did Not Lift Risk Appetite
The day's big market event was Anthropic, the developer of the Claude AI models, starting to trade on Nasdaq under the ticker ANT. The company sold 980 million shares at $83 each and raised $81.34 billion. The stock opened at $111.50, a 34% jump, and for a short time pushed the company's valuation above $2 trillion.
- Nasdaq Composite-1.55%
- S&P 500-1.59%
- Dow Jones-2.03%
That excitement stayed with one ticker. By around midday Eastern time the major U.S. benchmarks were all lower. Investors are still uneasy about how much is being spent on AI infrastructure and whether that money will ever pay off. Some had hoped a landmark debut would pull buyers back into battered tech names. The rest of the market kept falling, and that hope faded quickly.
| Index | Move by 12:18 p.m. ET |
|---|---|
| Nasdaq Composite | -1.55% |
| S&P 500 | -1.59% |
| Dow Jones | -2.03% |
Background: Crypto Was Already Under Pressure
Bitcoin's slide began well before Anthropic's first trade. Investors have been pulling money out of U.S. spot Bitcoin exchange-traded funds. Net outflows have reached roughly $2.9 billion so far in November, including $306.4 million on Wednesday alone.
The macro backdrop explains much of this. Bond yields have been climbing, and markets now expect the Federal Reserve to keep tightening, possibly with more hikes. Historically, that kind of environment hurts assets with no yield and high volatility, and Bitcoin is one of them.
Some traders say the Anthropic offering drew cash away from digital assets. Nobody has shown that this is true. Bitcoin and AI-linked equities have been falling together, which looks more like a general move away from risk than money rotating out of crypto and into one new stock.
What the Chart Is Signalling
The death cross
In its classic form, a death cross happens when the 50-day simple moving average falls below the 200-day average. Traders read it as a sign that short-term momentum is weakening. The version confirmed on Thursday uses exponential averages, which give more weight to recent prices and so react faster. Bitcoin is trading under both lines, and the faster one is now below the slower one.
Momentum and trend strength
- RSI at 21.3: far under the 30 mark that usually means oversold. That can come before a relief bounce, but it does not guarantee one.
- ADX at 41.2: anything above 25 generally points to a strong trend. ADX measures how strong a trend is, not which way it runs.
- Directional indicators: the negative line is above the positive one, so sellers are in charge.
- Price structure: each peak and each trough since September has come in lower than the last. November's sharp drop broke through several support zones.
Key Levels Traders Are Watching
The price is sitting almost on top of the nearest support. These are the levels marked on the daily chart:
| Level | Type |
|---|---|
| $76,984 | Resistance (upper) |
| $73,785 | Resistance |
| $71,539 | Resistance |
| $69,292 | Resistance |
| $66,512 | First hurdle for a recovery |
| $62,019 | Immediate support |
| $60,000 | Psychological support |
| $56,841 | Fibonacci extension |
A daily close under $62,019 would bring the round $60,000 figure into play, and below that the $56,841 extension. If buyers push back above $66,512, the next test would be near $69,292.
Our Assessment: Oversold, But Not Yet Turning
Bitcoin is caught between two opposing signals. The very low RSI says the selling has gone too far, too fast. The EMA crossover and the high ADX say the downtrend is still strong. In general, oversold conditions can last a long time inside a powerful trend. That makes $62,019 the level that matters most in the short term.
The bigger open question is the macro one. ETF outflows and rate expectations look like the real drivers, more than any one equity event. For now, watch whether ETF redemptions slow down, how Treasury yields move, and whether Bitcoin can hold a daily close above its nearest support.
Sık sorulan sorular
What is a Bitcoin death cross?⌄
A death cross is when a shorter moving average, traditionally the 50-day, drops below the longer 200-day average, a sign of weakening short-term momentum. Bitcoin's version uses exponential moving averages, which react faster to recent prices, and it was confirmed on Thursday.
Did the Anthropic IPO cause Bitcoin to fall?⌄
There is no proof of that. Bitcoin was already falling before the listing, with spot ETF outflows of about $2.9 billion this month, and it has been dropping alongside AI stocks, which suggests a broad retreat from risk rather than money moving into Anthropic shares.
What are the key Bitcoin support and resistance levels now?⌄
Immediate support is near $62,019, then the $60,000 mark and a Fibonacci extension around $56,841. On the upside, a recovery would first need to retake $66,512, then $69,292 and $71,539.
Bu haber hakkında ne düşünüyorsunuz?
Kaynaklar
Bu haber hakkında
TokenMarketCap haber masası tarafından yazıldı. Aynı gelişmeyi anlatan birden fazla bağımsız kaynağı okuyup haberi kendimiz yazıyoruz; kimsenin metnini yeniden yayımlamıyor ya da çevirmiyoruz. Sayılar yayından önce kaynaklarla karşılaştırılıyor.
Güncellendi: 19 Kasım 2026
Bu içerik yalnızca bilgilendirme amaçlıdır, yatırım tavsiyesi değildir. Karar vermeden önce kendi araştırmanızı yapın.